Wonk warning: I’ll be explicating the chart above. If this sort of thing bores you, or just gets you more, not less confused about what’s going on with the river today as the negotiators for post-2026 system management continue to negotiate with a November 11 deadline, then I’d say take a break until next post, when I’m going to try to explain why I call this stuff ‘Romancing the River.’
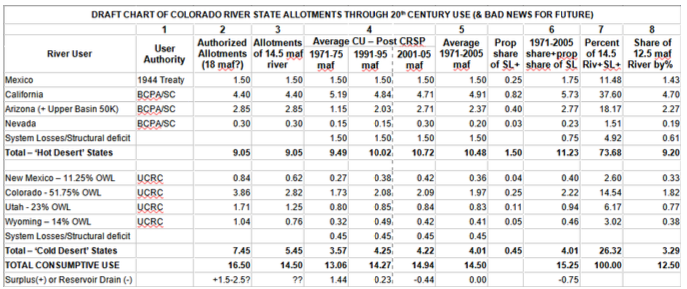
For those reading on here, remember my purpose from earlier posts: to show a reasonably equitable division of the consumptive use of the Colorado River waters among the seven states and Mexico, with no ‘temporary’ division into competitive Upper and Lower Basins – the Compact they really wanted to do in 1922. I present the table above as just a draft effort in that direction; there will be arguments about some of the specific figures, but the method to the madness might have some merit.
All the consumptive use information is from Bureau of Reclamation records accessible online, or from other cited historical documents going back to the 1922 Compact. The Bureau publishes consumptive use records every five years – eventually. (Figures for 2016-2020, for example, still have ‘Coming soon!’ where one would click to get them.) All quantities are expressed in millions of acre-feet (maf) or thousands (kaf).
To just jump into it, here’s a column-by-column explication of the chart. I suggest clicking on the image above to get an enlargable view of the table. If nothing else, this table is kind of a history-in-numbers of the Colorado River in the 20th century CE. (It is important to remember too that, thanks to the 1952 McCarran Amendment, all the Indian tribal rights are negotiated intrastate, although suits and appeals go to the federal courts – a separate set of challenges from what the seven states are trying to negotiate right now.)
Column 1, River Users: I make no reference to the Upper and Lower Basin, but it does make sense to distinguish between the ‘hot desert’ states below the canyon region, and the ‘cold (orographic) desert’ states above the canyons, due to the significant difference in system losses – evaporation, transpiration, bank and aquifer storage and other losses. We will start with some analysis of those lines in the table, one for each set of desert states (considerably higher for the subtropical ‘hot desert’ region than the higher and cooler ‘cold (or steppe) desert’ region.
System Losses, Structural Deficit and Surpluses: These constitute the river’s wild card. Natural system losses were listed in the paragraph above – all the natural things that happen to water mixed with sun, wind and thirsty ground. Storage reservoirs are built on snowmelt rivers to increase the amount of water available for use through a longer period of time, storing the two-month snowmelt flood for use through the rest of the year. But increasing in reservoirs the amount of water available for use does not increase the amount of water; in fact, it decreases that, as the stored water spreads out in reservoirs under a desert sun that can evaporate annually as much as six acre-feet per acre off of open water in the lower Colorado River.
This was completely ignored in the Colorado River Compact, despite the fact, that as Eric Kuhn and John Fleck pointed out in their book Science Be Dammed, there were scientists who tried to advise the commissioners. Today, with two huge reservoirs, another half dozen big reservoirs and a lot of little ones, along with around 600 miles of large open aqueducts meandering through the hot deserts, somewhere between 12 and 16 percent of the river is lost to the system under the sun and wind.
The compact commissioners, thinking they had an 18 maf river, believed that evaporation would be covered by the surplus they anticipated above and beyond the quantities consumed by the seven states and Mexico. That was actually the case, well into the 1980s. But as more users materialized in the states above the canyons, and the Central Arizona Project began to draw from the mainstem, the ‘structural deficit’ from ignoring the system losses began to draw down the big reservoirs. These natural system losses were estimated at around 800,000 af annually from the mainstem for the states below the canyons, and between 400,000 and 500,000 from Powell and the other Colorado River Storage Project reservoirs.
Another element in the structural deficit was consistent provision for Mexico’s treaty allotment of 1.5 maf per year. The compact made the Upper and Lower Basin each responsible for half of whatever portion of that allotment which was not covered by surplus flow (up to 750 kaf). Beginning in 1971, however, under a 1970 reservoir management agreement, the Bureau began releasing the Upper Basin’s full half of the 1.5 maf each year, whether it was a ‘surplus year’ or not. A similar arrangement was not made for the Lower Basin share of the Mexican allotment; the Bureau apparently has just continued to charge it to ‘surplus’ – along with the Lower Basin’s system losses – whether or not there was actually that much surplus. These ‘structural deficits’ were almost as responsible for the big 21st-century reservoir drawdown as was the ‘millennial drought.’ A figure of around 2 maf was established for these natural and cultural commitments: 1.5 maf for the ‘hot desert’ states, 1.2 maf for the ‘cold desert’ states – those states having consistently delivered their 750 kaf share for Mexico (leaving the 450 kaf in the table). The three states below the canyons have apparently agreed to accept responsibility for their 1.5 maf after 2026, although they are not saying much yet about how that consumption will be divided up.
Back now to the columns.
Column 2, Authorized Allotments: These are based on the 18 million acre-feet (maf) river we all believed we were working with back in the 1920s. The Colorado River Compact allotted 7.5 maf to each of its Basins. The Boulder Canyon Project Act made the Bureau water-master for the Lower Basin states, and set their individual allotments, contested by Arizona but confirmed by the U.S. Supreme Court in the last Arizona v. California case (BCPA/SC). The Mexican allotment was set by the 1944 two-rivers treaty. And in 1948, the four Upper Basin states created the Upper Colorado River Compact. Knowing by then that it was not an 18 maf river, they gave themselves percentages ‘of whatever’s left’ (OWL) after compact obligations to the downriver states and their share of the Mexican treaty obligation were fulfilled. This column shows what that ‘% OWL’ would be if those states actually got 7.5 maf regularly. The cold-desert states have never even come close to those figures.
Column 3: This column shows the allotments for the 14.5 maf average of the river’s ‘natural’ flows for the 1930-2000 period, the period when all of the river’s major development took place. All of the ‘averaging’ fell on the states above the canyons. Allotments for Mexico and the three states below the canyons were legally and physically ‘set in concrete’ at 9 maf – legally by the Supreme Court affirmation of the BCPA allotments, and physically by the two big linked reservoirs, Mead and Powell. The four states above the canyons took their floating percentages from what nature provided, or didn’t – estimated natural flows for that period ranged between 5 and 24 maf. The average ‘of whatever’s left’ (OWL) after the obligatory quantity was sent to the states below the canyon and Mexico was assumed to range between 5 and 6 maf – if no attention was paid to the structural deficit and system losses. And for most of that period, there were no worries there; the states above the canyon were not using that much water until the substantial transmountain diversions (100 percent depletions) were completed. The table figures for those states (unlike the figures for the states below the canyons) amounted to wishful thinking for a future that will never happen.
Column 4 gets real: a compilation of three columns with five-year consumptive use averages for three periods, covering the time when the physical development of the river storage and delivery systems was being completed, and consumptive use of the river was approaching full development too – but just on the edge of the trauma of the ‘millennial drought’ (which may last for a millennium) and the near-collapse of the storage system. The attempt at normal distribution for the 2001-2005 period might be considered just beyond that edge – like the roadrunner cartoons, when Wiley Coyote runs a few yards into the air beyond a cliff – then looks down…. These dates are bookended by two ‘reservoir coordination’ elements in the ‘Law of the River’: the 1970 ‘Criteria for the Coordinated Long-range Operation of Colorado River Reservoirs’ and the 2007 ‘Interim Guidelines’ for coordinated operation of the Powell and Mead Reservoirs, set to expire next year.
The Bureau’s five-year compilation tables include, for the first time maybe, the system losses/structural deficit.
Something worth noting: California’s consumptive use during this 35-year period started well above the state’s 4.4 maf compact allotment, and then declined, while uses for all the other states were increasing. This is because California’s major users had decided, before Hoover Dam was even started, that they would ‘borrow’ 800,000 af of unused Upper Basin water until the Upper Basin needed it. They would, in other words, grow on borrowed water. The Bureau of Reclamation allowed this, because they assumed that the Colorado River would eventually be augmented by even greater public works from some larger river basin. Optimism is a sunny thing. On the strength of this, the Metropolitan Water District on the Southern California coast built its 250-mile aqueduct to carry twice the 500,000 af that was their share of California’s 4.4 maf allotment. They began decreasing their ‘borrowed’ usage during this 35-year period, in anticipation of the 2006 California Limitation Act – thanks mostly to the California State Water Project exporting water from Northern California.
Arizona’s jump in usage between 1971-75 and 1991-95 was due to the completion of the Central Arizona Project. To give a more accurate picture of ‘the completed river system,’ only its 1991-95 and 2001-2005 figures were used in compiling Column 5.
Column 5: A compiled average for the three five-year periods – resulting in the 14.5 maf river of 1930-2000.
Column 6: An attempt to divvy up the system losses/structural deficit (SLD) between the seven states and Mexico. My operating assumption is that the ‘hot desert’ states and the ‘cold desert’ states should share these losses proportionally to their consumptive use. This meant creating percentages of the 9.0 maf of decreed use for the four entities below the canyons; the four entities above the canyons were already operating on percentages.
I’m sure the state (guess which one) with a lot of pre-compact ‘senior’ water will object vehemently to this concept, wanting all the junior users to absorb those losses. This is a misapplication of the appropriation doctrine, in my estimation; it was set up for resolving differences among specific users, not for the resolution of major river management issues related to natural phenomena like evaporation and riparian storage, or natural and cultural changes like a warming climate. These issues fall equally on all users, everyone’s fault and responsibility. But such rational and moral arguments will probably not dent California’s resolve of seniority uber alles.
Column 7 just adds those proportionate shares of the system losses/structural deficit to the consumptive use averages for the seven states and Mexico in Column 5, leaving the system losses/structural deficit lines empty. This is not increasing the amount of water for each state; it is increasing the amount of consumption each has to manage. This column, I’m arguing, is the seven-way equitable division of consumptive use that the Compact commissioners wanted to create in 1922, but lacked the information about both the river and their futures to develop. Now, a century later, that future is here, like it or not, and we’re sadder but wiser in knowing the river.
There’s probably an error at the bottom of this column; instead of 0.00 in the ‘Surplus or Drain’ column, it should probably be ‘-2.00 maf’: the difference between the 14.5 maf 20th-century river and the 12.5 maf early 21st-century river. This was the frightening drawdown of the early 21st century decades.
Column 8 then uses the Column 7 figures to calculate what percentage of the 14.5 maf river each of the eight entities ‘owns.’
Column 9 then applies those percentages to the 12.5 maf Colorado River of the 21st century – and subtracts from each state’s total consumption its share of system losses and structural deficit – thus showing what each state will actually have with which to try to do what it is doing today with its presumed allotment for consumptive use of the 14.5 maf river of bygone days. Read it and weep. (Note that I’ve put the 1.5 and 0.45 maf system losses/structural deficit numbers back in Column 9 to remind you that they have not disappeared from the system; they’ve just been re-collated from those portions of the individual states’ total consumptive uses.)
I would welcome comments and criticisms of this work. I do believe it is the kind of pinning down of numbers we need to finally do for the Colorado River, if we are going to go into the post-2026 era with our eyes open. ‘Woke,’ you might say.
By my next post, there will probably either be a new management plan for the river in the messy agonies of birthing – or there won’t. If there is, I would wager a six-pack that they will drag along the old two-basin cold-war division. And I’d wager further that the ratio of total consumptive use for the four ‘states’ below the canyons to the four states above the canyons will be between within a few points either way of 70-30. Is that ‘equitable’? Given the amount and productivity of land under cultivation, and the number of people gathered in large metropolitan ganglia, and the location of most of the Indian nations, it probably is. But – it’ll probably be another point of discussion.
Leave a Reply
Recent Posts
- Advertisement for My Self + Romancing the River – Elephants in the River
 This is the cover of a new book I’ve just published, Storm in My Head, a collection of poetry written over the 60 years I’ve been living in the headwaters of the Colorado River, since 1966. My 60-year celebration. Those of you who prefer your literature in sprints and strolls over the marathon essays I ... Read More
 - Romancing the River: The Era of Conquest 3
 A bad year in the Colorado River Basin – barring a truly miraculous spring, probably the worst in recorded history. It is bad enough so the Bureau may have to stop creating power from the Glen Canyon powerplant by this coming fall. At that point, the only way to get water downriver from Glen Canyon ... Read More
 - Romancing the River: The Era of Conquest Part 2
 The hard news about the Colorado River since my last post here is not good; we had a storm that dropped around two feet of snow above the 8,000-foot elevation – well, maybe the 9,000-foot elevation. But that was followed by a couple weeks of ridiculously warm weather for February and early March, with more ... Read More
 - Romancing the River – The Romance of Conquest, Part 1
 We’re an empire now, and when we act, we create our own reality. – Senior advisor to Pres. G. W. Bush, 2004 You’ve seen that quote here before – and you’ll probably see it again; if this were a Wagnerian opera, that line would be a lietmotif, a recurring musical thread associated with a particular ... Read More
Thanks for putting all this together! As a numbers geek similarly obsessed with the issues you dive into, I need to spend more time making a critical assessment of your methodology and results, but I like the way you went about approaching this. I do believe, however, in the big picture, that the original motivation behind the 1922 Compact was never about “fairness” or “equity.” I think it came about as hastily as it did in response to the state of Colorado seeing the handwriting on the wall in the wake of a recent huge loss in the Supreme Court in Wyoming v. Colorado, where the court upheld Wyoming’s prior appropriation of a water supply that originated in Colorado. In the end, the upper basin states got as good a deal as they could when California held all the cards in the interstate negotiation… falsely assuming the river would always flow high enough to avoid a game of musical chairs they would be certain to lose…
You’re right in that the Compact commission was pulled together because of the ‘handwriting on the wall’ in Wyoming v. Colorado, but this gave an aura of reality to the six states concerns about California’s galloping development. There was also the matter of authority in developing a contested interstate river; the states wanted the federal government to fund and operate the river controls, but did not want to give up their authority over whatever water they could each claim and control. And some measure of equity was important; they really didn’t want any state to get shut out for being slow to develop (probably for fear it might be them), and they did hold a big card, the fact that Congress would not fund the big dam California really needed if all the other states were opposed to it for fear of being shut out. It was too much to sort out in a month – which is why Hoover summarized their work as a ‘temporary division,’ that would however allow the big development to happen….
And, after this last week it probably doesn’t matter. We have the dumb and even dumber in charge and the water will be needed for fossil fuel development and golf courses. Not sure which takes priority. But I pretty much guarantee that anything the ‘people’ or states might want will be ignored. King’s do NOT care who suffers as long as it is not them or their richest courtiers.